
From 1926 through June 2024, the S&P 500 had compounded at an inflation-adjusted return of 7.2% per year. That’s a pretty darn good average. Real returns have not been this high in most other countries but the winners write the stock market history books, as they say.
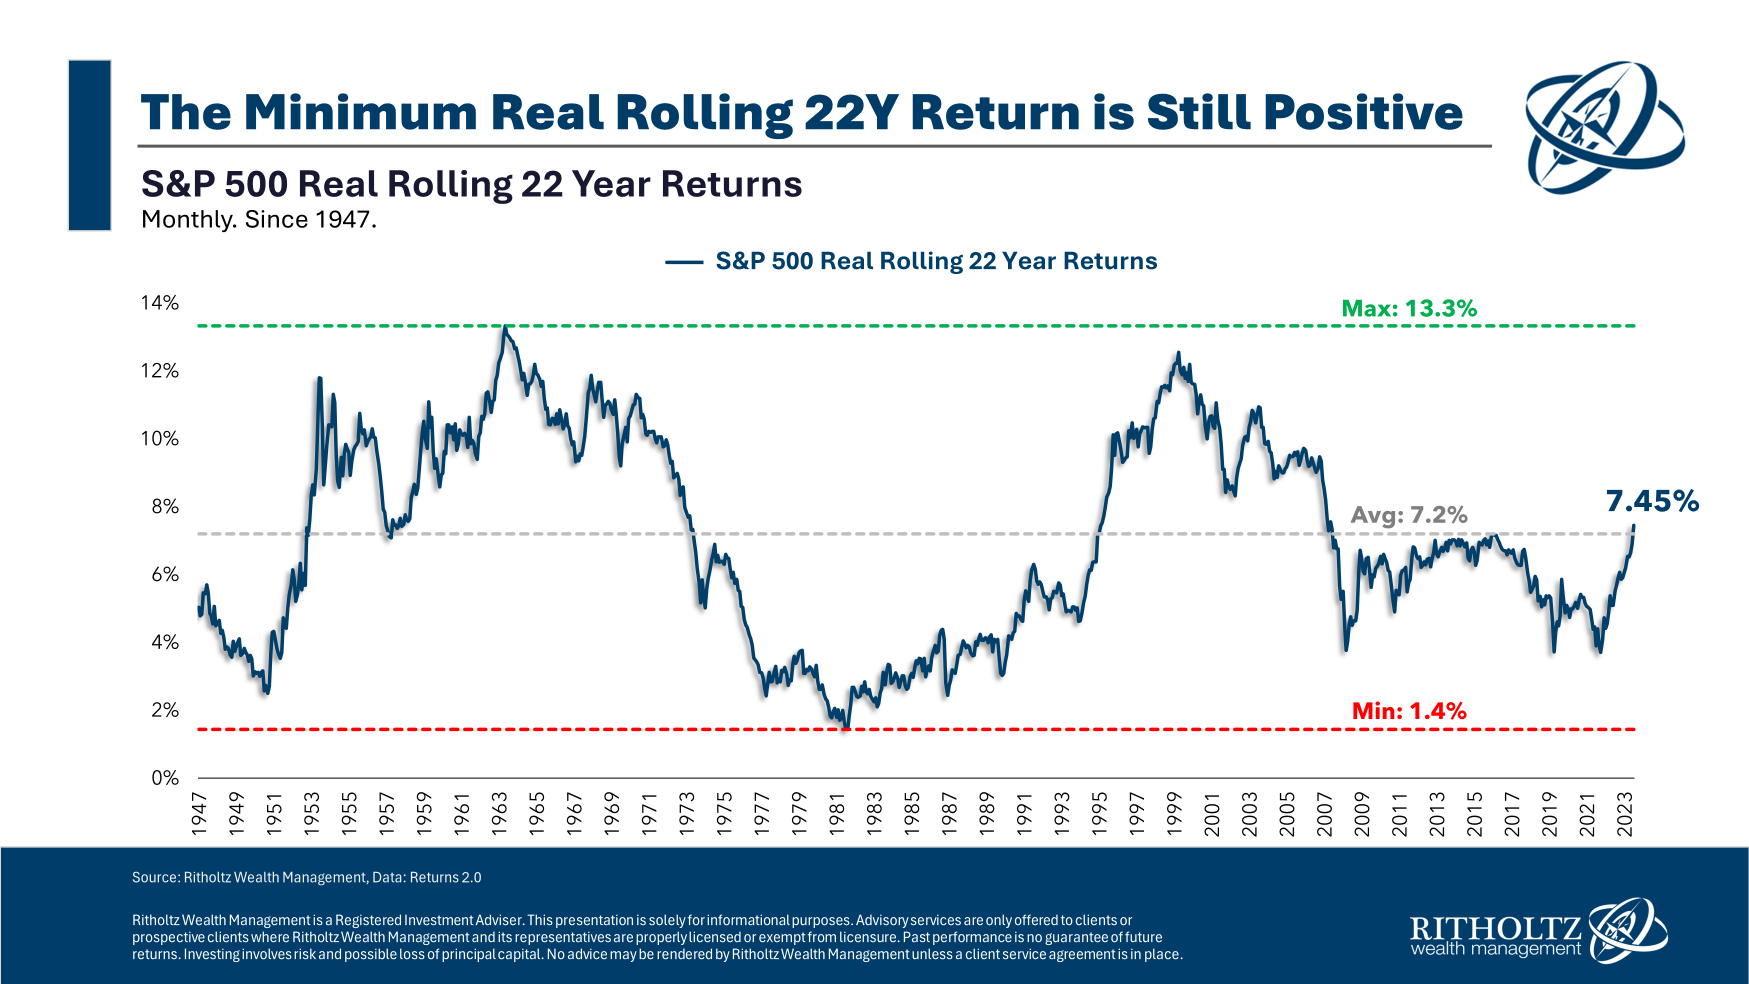
Here’s a look at the rolling 22-year real annual returns for the S&P 500.
Surprisingly, the worst 22 year period for real returns was not in the aftermath of the Great Depression but rather in the 1970s. The two-plus decade real return ending in the summer of 1982 was just 1.4% per year. That time frame featured an annual inflation rate of nearly 6% which is a high hurdle rate to beat.
The best return came in the period leading up to that high inflation, with a 13.2% real annual return ending in the spring of 1964. The period after the 1970s debacle also produced wonderful real returns, with close to 13% annual inflation-adjusted gains ending March 2000.
As always, markets are cyclical.
The most recent period ending June 2024 was close to the long-term average at 7.5% real annually.
The good news is that real returns have not been negative over the past ~100 years. The bad news is that there can be a wide range of results, even over the long run.
Here are the historical win rates at different annual real return levels:
At least 3% (92% of the time)
At least 4% (80% of the time)
At least 5% (71% of the time)
At least 6% (59% of the time)
At least 7% (45% of the time)
At least 8% (40% of the time)
 What's the Worst Long-Term Return For U.S. Stocks? - A Wealth of Common Sense